Madelbrot Set using Python
Mandelbrot sets look cool. They can be created using Python. The calculations can be done using Numpy (which makes it simpler and faster), and plotted using Matplotlib. In bried, a Mandelbrot set is an iteration of calculations using complex numbers. The concept falls within the are of Chaos, Fractals, and Complex Numbers.
This article shows how to make this figure below:
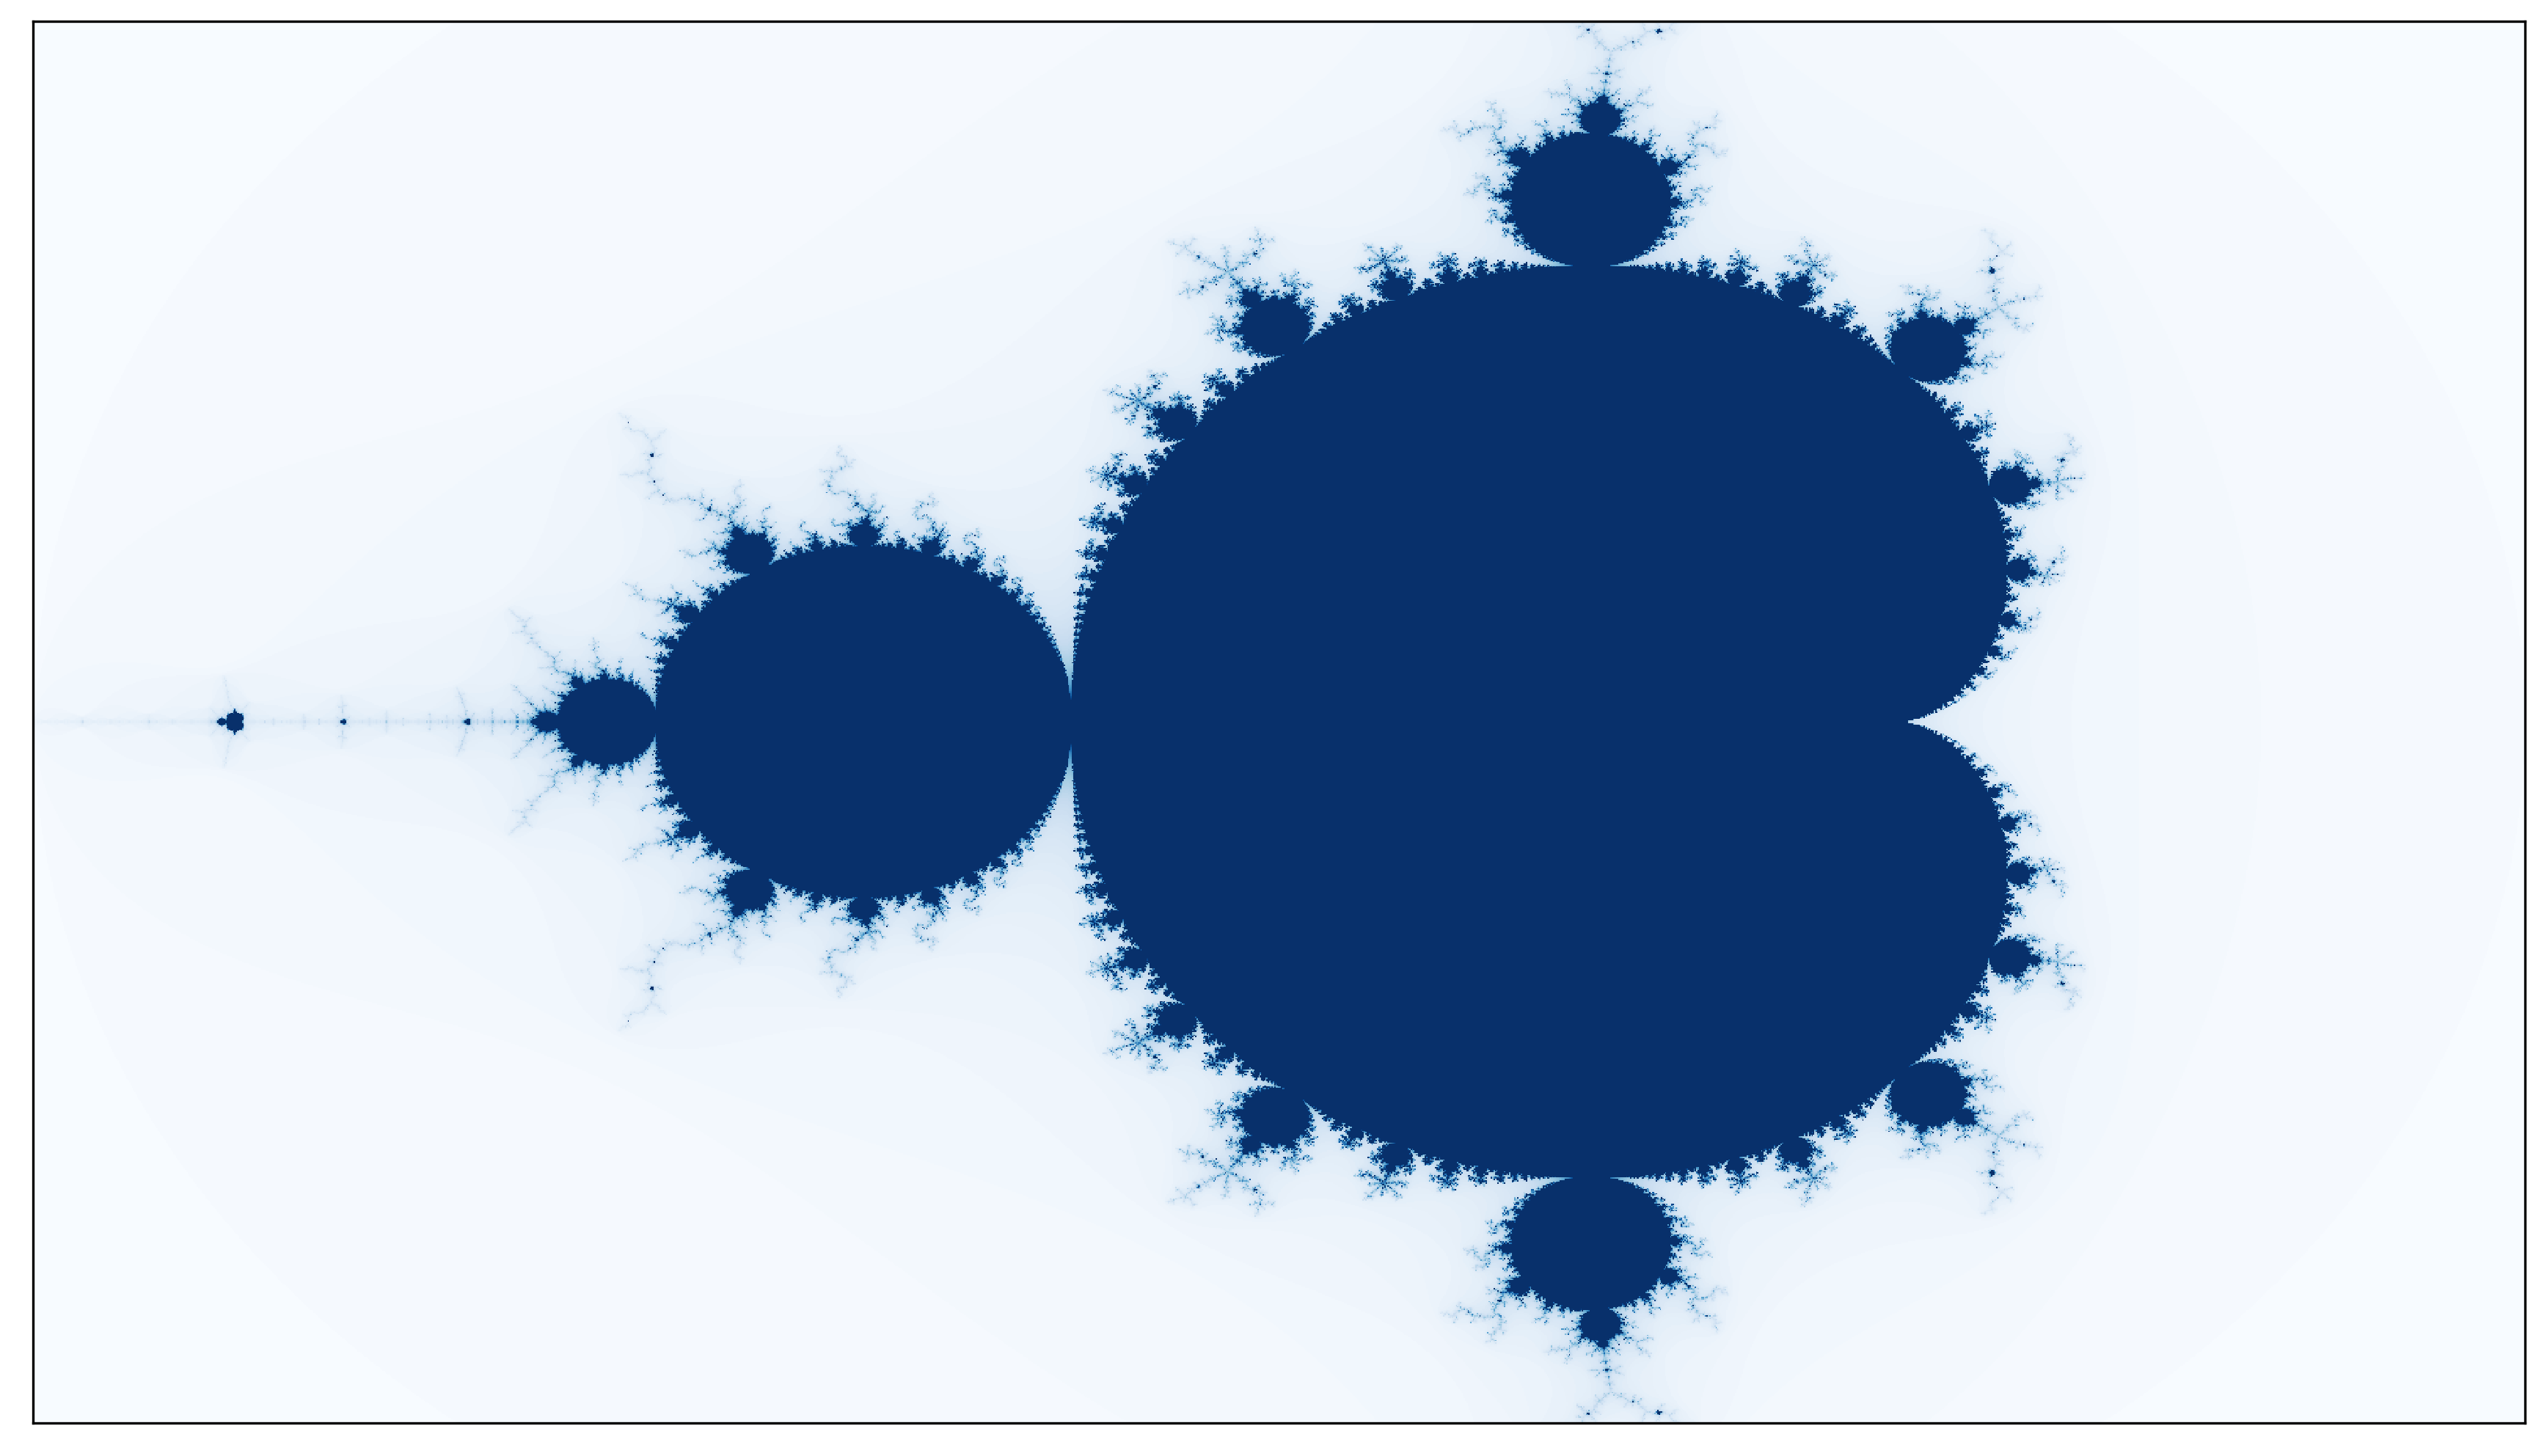
Each small part (pixel) in that figure is computed using iterations; For a number of iterations, we redo f(z) = z^2 +c on each pixel, until the value in that pixel reached infinity (Simplification: it becomes bigger that a defined number, which is 2 in this case. The following code will explain it better.
Import Packages:
The following packages are required:
import numpy as np
import matplotlib.pyplot as plt
Define the “big matrix”:
I am calling it the “big matrix” because this is actually a matrix that holds the value of each pixel in figure.
First we create x and y vectors, which are the x-axis and the y-axis.
x = np.linspace(-2, 1, 2000)
y = np.linspace(-1, 1, 1000).reshape((-1, 1))
We create the z matrix, using x and y. z is a complex matrix. The real numbers comes from x, and the imaginary parts come from y.
z = x + y*1jThere are two more matrices: c and r. Both have the same shape as z, and both are iniated with zeroes. c will contain complex numbers, and r will contain integers.
c = np.zeros(z.shape, dtype=np.complex)
r = np.zeros(z.shape)
The Main Loop:
The main loop is very small (and can be confusing at first):
for i in range(200):
  cond = (np.abs(c) < 2)
  c[cond] = c[cond] * c[cond] + z[cond]
  r[cond] = i
Explanation:
First, we will need the “pixels” in the matrix c that have an absolute value less that 2. There are the only pixels that we will keep iterating on.
cond = (np.abs(c) < 2)Second, we will iterate over the pixels we selected in the previous step, using the function mentioned before f(z) = z^2 +c. (Yeah, I switched the c and z values here…)
c[cond] = c[cond] * c[cond] + z[cond]Finally, we update update the values in the the matrix r using using the current interation integer number i. Remember: this is still only done on the values that we selected in the first step. Why? Because this way we will have values, at each pixel, with the iteration number at which that pixel became > 2. When we plot the matrix r, the numbers will be translated into colors.
r[cond] = iPlotting:
Final Step: Plot the matrix r using plt.imshow. Use cmap="Blues" to have a blue color map.
plt.figure(dpi=150)
plt.imshow(r, cmap="Blues")
plt.xticks([])
plt.yticks([])
plt.show()
This is the final Product:
Complete Notebook:
| import numpy as np | |
| import matplotlib.pyplot as plt | |
| x = np.linspace(-2, 1, 2000) | |
| y = np.linspace(-1, 1, 1000).reshape((-1, 1)) | |
| z = x + y*1j | |
| c = np.zeros(z.shape, dtype=np.complex) | |
| r = np.zeros(z.shape) | |
| for i in range(200): | |
| cond = (np.abs(c) < 2) | |
| c[cond] = c[cond] * c[cond] + z[cond] | |
| r[cond] = i | |
| plt.figure(dpi=150) | |
| plt.imshow(r, cmap="Blues") | |
| plt.xticks([]) | |
| plt.yticks([]) | |
| plt.show() |